Introducing a new writing tool from the maker of QueryTracker.
Learn More...
Introducing a new writing tool from the maker of QueryTracker. Learn More...

Query Timelines - Help

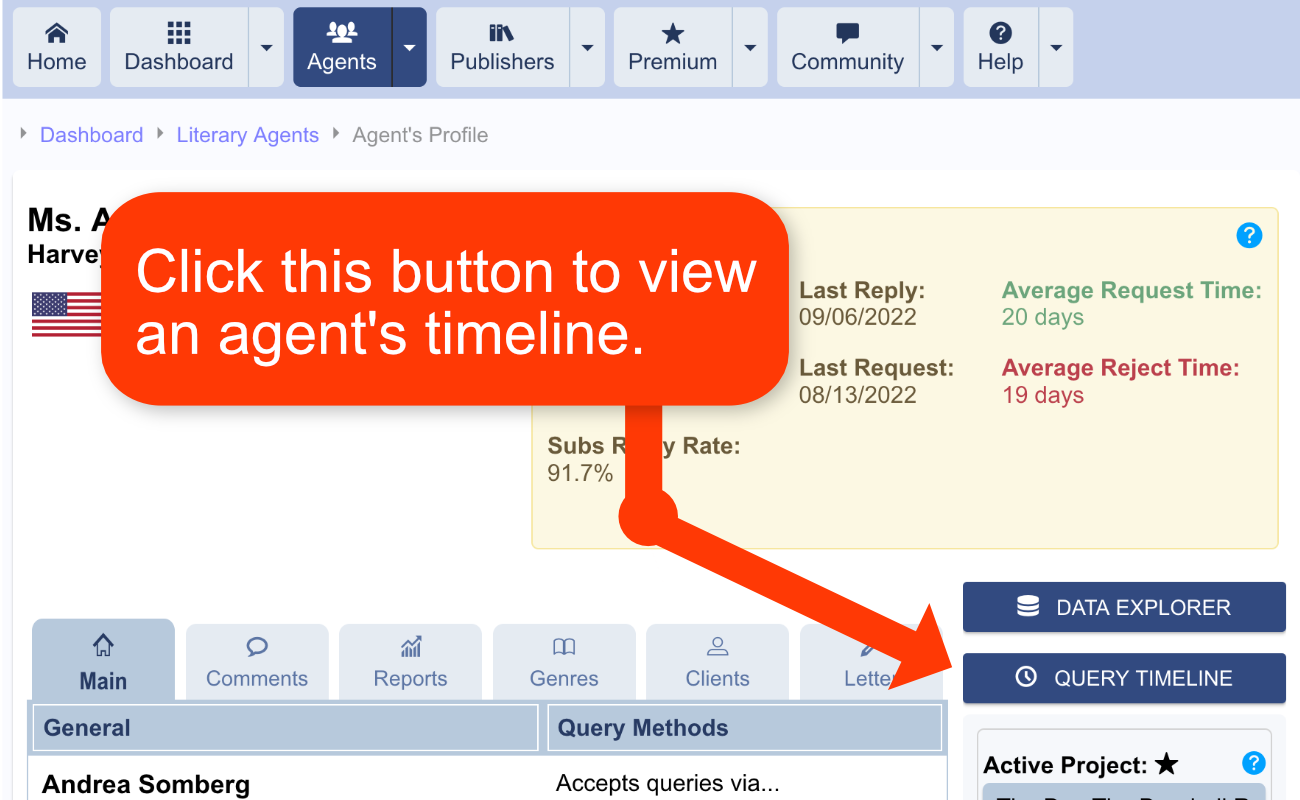
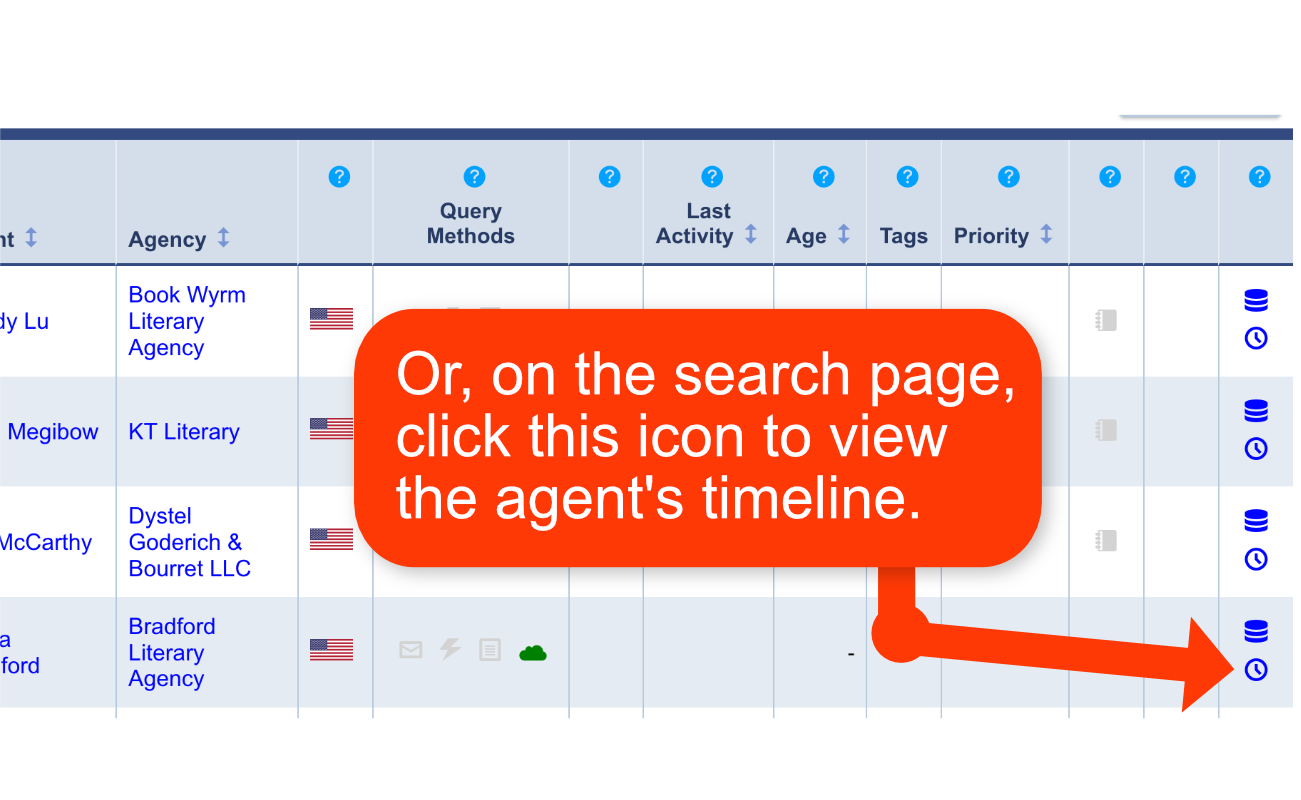
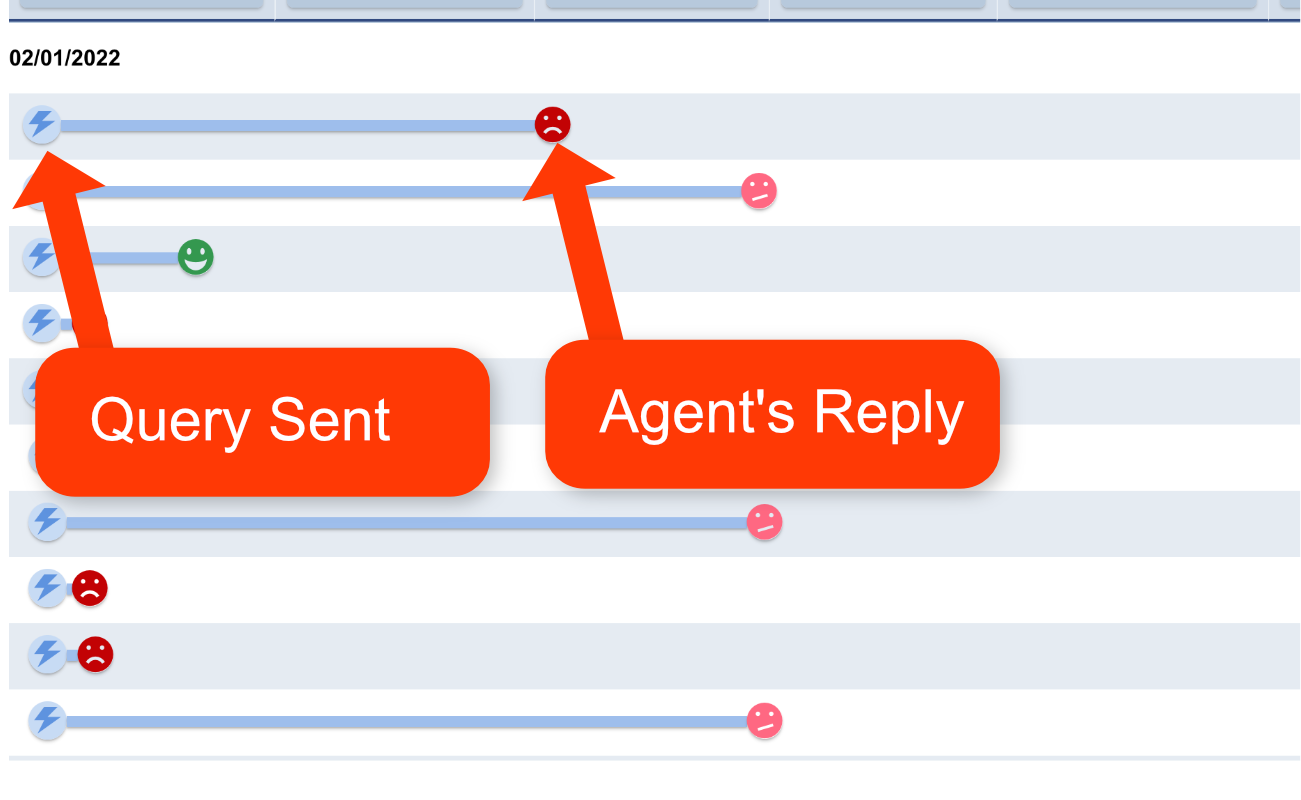
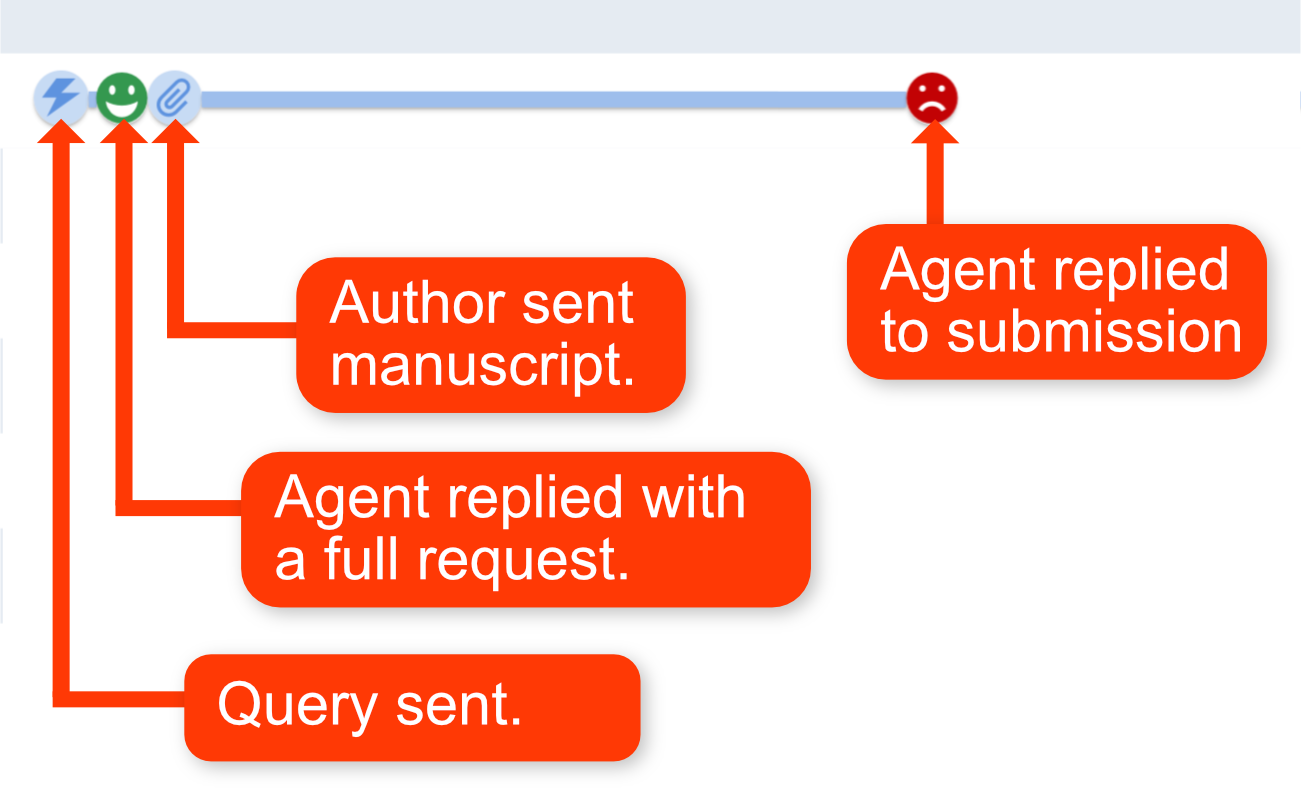
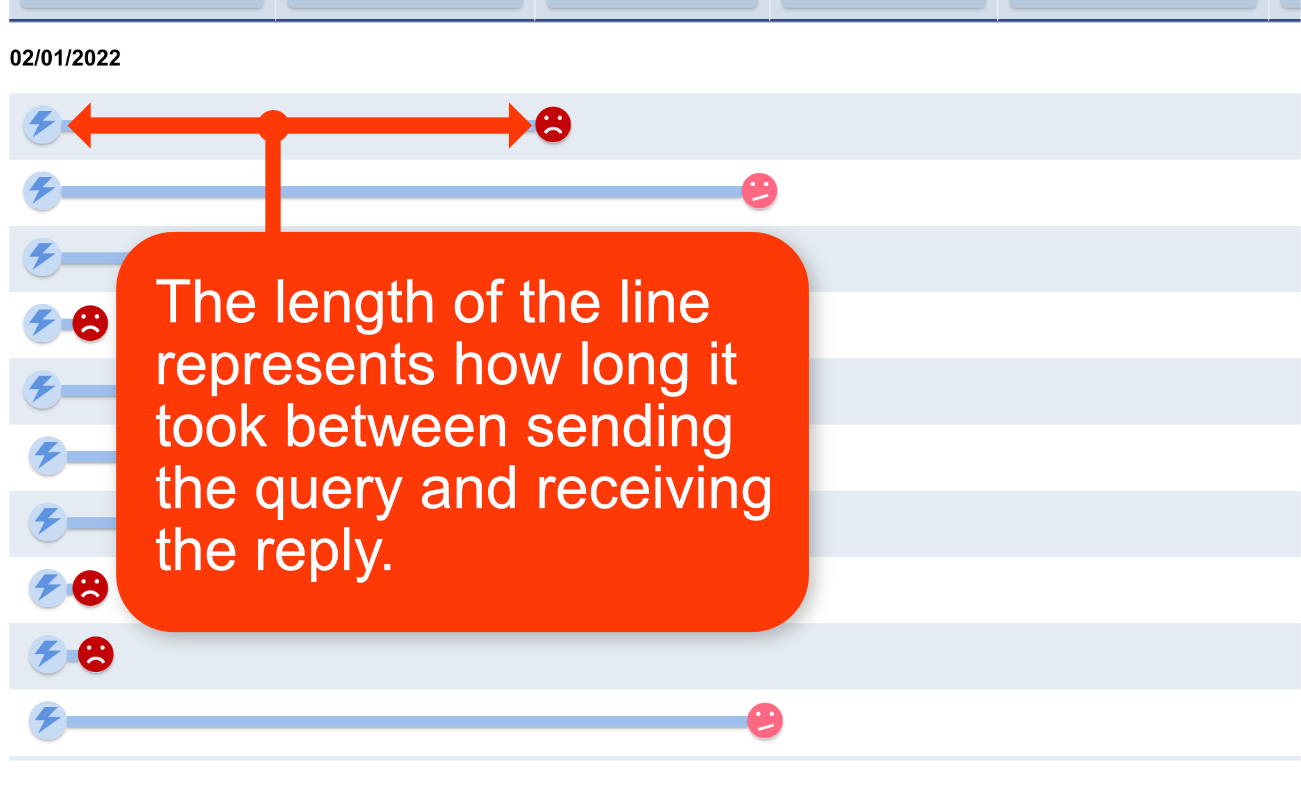
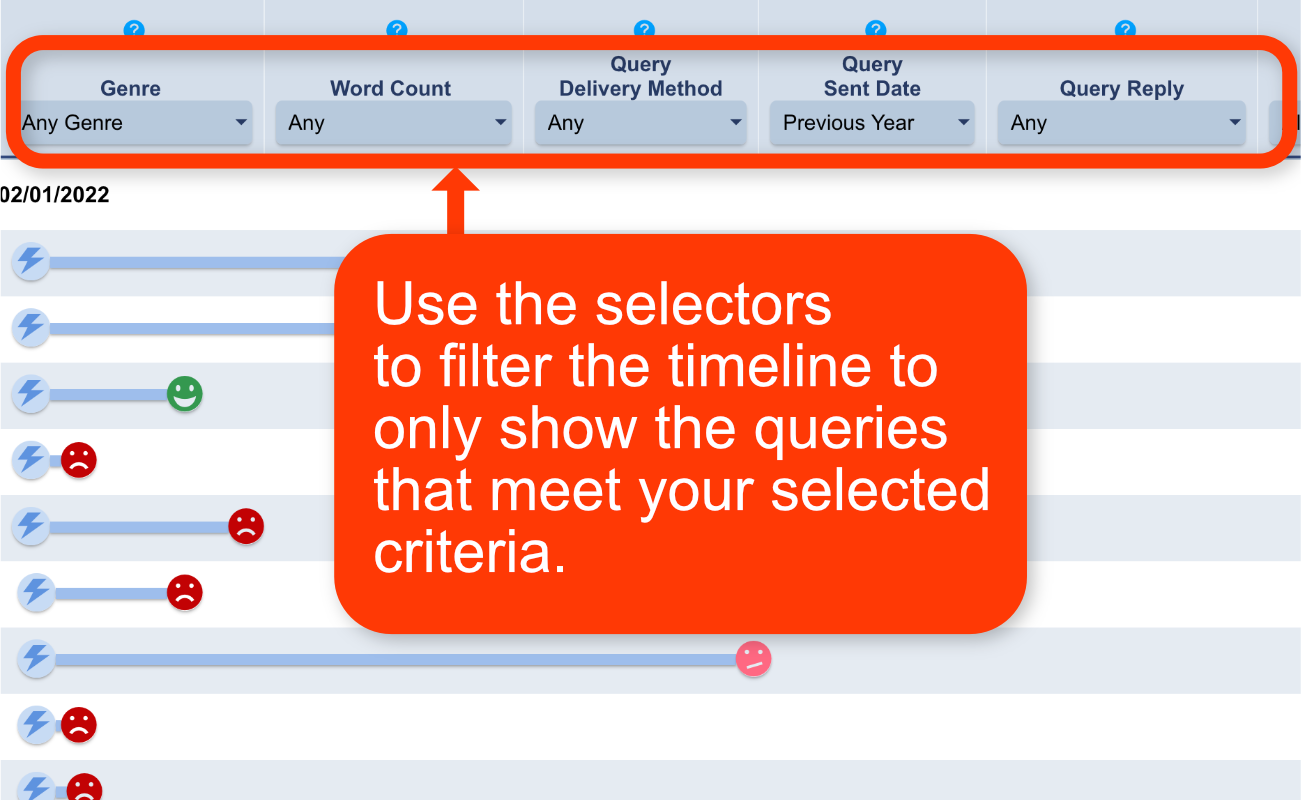
A query timeline is a graph, showing the query history for an agent. It takes all the queries recorded on QueryTracker for an agent, and lays them out in a linear chart.

Note: Though this tutorial references agents, the process is the same for publishers.

Query Timelines

Introduction to Query Timelines.

To view an agent's timeline, click the timeline button on the agent's profile page.

You can also view an agent's timeline by clicking the time icon on the agent's page.

Note: The "Data View Mode" on the search page must be set to "General" before the icon will appear on the agent's page.

Each row represents a single query that was sent to this agent.

The icon on the left shows how and when the query was sent.

The second icon represent the agent's reply.

Here are some common icons you'll see...

The query was sent via E-Mail.

The query was sent via online form.

The query was sent via QueryManager form.

The agent requested a full manuscript.

The query was rejected.

The query was closed due to no response. Implied rejection.

View full list of icons.

Each circle along the line represents an event in the life of the query.

Such as when the query was sent, when the agent replied, when a submission was sent, etc.

A paperclip shows when a submission was sent, and the line and icon after the paperclip represents the agent's reply to the submission.

The length of the line between the query sent point and the agent's reply represents the amount of time it took to receive the reply.

The longer the line, the longer the reply took.

You can filter the timeline using the selectors at the top of the display.

Filter queries by genre, word count, delivery method, sent date, reply or reply date.